|
|
|
Excel To KML - Display Excel files on Google Earth.
A user account is recommended for the features on this web page.

Import a spreadsheet of lat/long coordinates to Google Earth. Pop-up balloons,
icons, paths, and polygons are easily created from the spreadsheet data.
|
|
A
|
B
|
C
|
D
|
E
|
|
1
|
Latitude
|
Longitude
|
Name
|
Description
|
Icon
|
|
2
|
43°36'34.86"N
|
116°12'23.30"W
|
BAM
|
Art museum
|
12
|
|
3
|
43 36 33.22
|
-116 12 18.40
|
Roses
|
Nice garden
|
111
|
|
4
|
43.608879028
|
-116.20320277
|
Zoo
|
Great visit
|
186
|
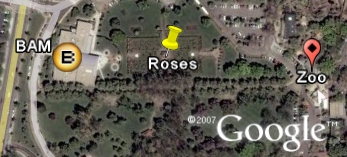
Sample points plotted onto Google Earth.
|
Latitude and Longitude are all that is needed to create a basic display on Google
Earth. Add a Name, Description, and an Icon for
a professional presentation.
Advanced features support GPS tracks, Time Sliders, and Grid Coordinates.
To get started, read the
Quick Start
instructions or download the sample data
ExcelToKmlDemo.zip.
Icon Text: Display text in the icons on Google Earth.
Polygons: Draw polygons onto Google Earth.
Select an Excel file (xls, xlsx, xlsm, xlsb, txt, or csv)
You are not signed in to your account. For unrestricted access, please sign in or
purchase a subscription. You must have Google Earth installed to use this data.
|
|
If you need help getting started, or if you have ideas for improvement, please write
or call.
Quick Start
- Open Excel.
- Enter these words into separate cells on the first row: "Latitude", "Longitude",
"Name", "Description", and "Icon".
- On the rows that follow, enter the attributes of each point.
- "Latitude" and "Longitude" are required. The other columns are optional.
- "Name" is the label that appears next to each icon on Google Earth.
- "Description" is the text that appears in the Google Earth pop-up balloon.
An Excel formula can be used to combine data from several
columns.
- "Icon" designates the icon that is displayed for each point. An easy way to
get an icon is to enter a number from the table
below. If the Icon column is left blank or if it is missing, icon number 166
is displayed. You can also enter an icon's "www" web address. If you
don't want an icon, enter the word "none".
- Save the worksheet.
- Click the "Browse" button above and select the worksheet you just created.
- Click the "View on Google Earth" button.
To Save The File
- In the "Places" window of Google Earth, right-click the folder "Earth Point Excel
To KML".
- From the pop-up menu, select "Save As".
Features
- Displays an xls, xlsx, xlsm, xlsb (Excel), csv (comma separated values) or txt (tab
delimited) file on Google Earth.
- Excel columns "Latitude", "Longitude", "Name", "Description", and "Icon" are all
that are needed for a professional looking presentation.
- Advanced options allow you to elevate the icon above the earth's surface, draw a
path ("connect the dots"), and control mouse-over effects.
- Icons can be specified by entering a number from the table below or
by entering the URL of an icon stored on a web server.
- Formulas may be entered into any cell of a spreadsheet. Formulas can be used to
specify icons, icon scale, format the Description text, etc. Formulas cannot be
used in csv or txt files.
- Column specifications are listed below.
GPS Track: use the following
columns: Latitude, Longitude, LineStringColor, Icon, IconColor, and IconHeading.
Enter "lime" or "yellow" into the LineStringColor column. For direction arrows,
enter "196" into Icon, "yellow" into IconColor, and "line-180" into IconHeading.
If you don't want an icon, enter "none" into the Icon column.
more...
|
|
A
|
B
|
C
|
D
|
E
|
F
|
|
1
|
Latitude
|
Longitude
|
LineStringColor
|
Icon
|
IconColor
|
IconHeading
|
|
2
|
43.6097
|
-116.2048
|
cyan
|
196
|
yellow
|
line -180
|
|
3
|
43.6095
|
-116.2047
|
cyan
|
196
|
yellow
|
line -180
|
|
4
|
43.6094
|
-116.2046
|
cyan
|
196
|
yellow
|
line -180
|
GPS track in a spreadsheet, csv, or txt file.
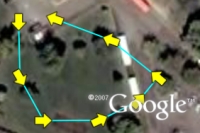
GPS track on Google Earth.
|
Time Slider: If you have
GPS tracks or other data that contains time information, you can view this information
sequentially using the time slider in Google Earth. Excel To Kml looks for
time information in columns labeled TimeWhen, TimeBegin, and TimeEnd. See
the specifications below.
Google Earth Blog
has more information about the time slider.
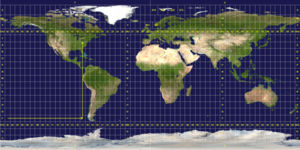
Universal Transverse Mercator grid.
Courtesy
Wikipedia.
|
Grid Coordinates: ExcelToKml
supports:
Universal Transverse Mercator (UTM)
Universal Polar Stereographic (UPS)
Military Grid Reference System (MGRS)
MGRS Polar
U.S. National Grid (USNG)
identical to MGRS
Global Area Reference System (GARS)
Maidenhead
used by amateur radio operators
World Geographic Reference System (Georef)
Plus Codes
what3words
State Plane
United States only
LatLon
can be joined as one coordinate. See the specifications
below.
Guidelines
- File name must end in ".xls", ".xlsx", ".xlsm", ".xlsb", ".csv", or ".txt"
- The first row that contains the values "Latitude" and Longitude" or the value "Position"
is considered to be the heading row. All previous rows are ignored. All subsequent
rows are treated as data.
- The columns listed below control the appearance of each
placemark. "Latitude" and "Longitude" are required. All others are optional. Any
column not listed is ignored.
- Multiple worksheets are allowed in an Excel workbook. Each worksheet name will be
displayed as a separate folder in Google Earth "My Places".
Security
Excel To KML security is comparable to sending an email to a trusted colleague.
Your data is transmitted over the internet and saved as a file on the Earth Point
server. The data is immediately sent back to your PC in the form of a KML
file and the original file is removed from the Earth Point server.
Columns Used By Excel To KML
Latitude, Longitude, Name, Description, and Icon are all that are necessary for
a professional looking presentation. Advanced options allow you to elevate
the icon above the earth's surface, draw a path ("connect the dots"), and control
mouse-over effects. Excel To KML ignores any additional columns in your spreadsheet.
|
Latitude and Longitude
|
|
Column Heading
|
Default Value
|
Description
|
|
Latitude
|
None
|
Latitude of point. Google Earth uses the WGS84 geodetic datum. Valid
formats include:
N43°38'19.39"
43°38'19.39"N
43 38 19.39
43.63871944444445
If expressed in decimal form, northern latitudes are positive, southern latitudes
are negative.
If blank or invalid, item is not displayed on Google Earth.
|
|
Longitude
|
None
|
Longitude of point. Google Earth uses the WGS84 geodetic datum. Valid
formats include:
W116°14'28.86"
116°14'28.86"W
-116 14 28.86
-116.2413513485235
If expressed in decimal form, eastern longitudes are positive, western longitudes
are negative.
If blank or invalid, item is not displayed on Google Earth.
|
OR
Zone, Easting, and Northing
|
|
Column Heading
|
Default Value
|
Description
|
Zone
|
None
|
For UTM, UPS, and State Plane coordinates, use the column headings Zone, Easting, Northing and optionally UnitOfMeasure.
UTM coordinates are assumed to be in meters. State Plane coordinates are assumed to be US Survey Feet. If a different measure is needed, then it can be specified in the UnitOfMeasure column. Supported values are
m - meters
UsFt - US Survery Feet
Ift - International Feet
An example of a UTM coordinate in meters
|
|
A
|
B
|
C
|
|
1
|
Zone
|
Easting
|
Northing
|
|
2
|
15S
|
306932
|
4316107
|
An example of a State Plane coordinate in US Survery Feet
|
|
A
|
B
|
C
|
|
1
|
Zone
|
Easting
|
Northing
|
|
2
|
1501
|
2100124
|
244910
|
The same State Plane coordinate expressed in meters
|
|
A
|
B
|
C
|
E
|
|
1
|
Zone
|
Easting
|
Northing
|
UnitOfMeasure
|
|
2
|
1501
|
640119
|
74648
|
m
|
|
Easting
|
Northing
|
UnitOfMeasure (optional)
|
OR
|
|
Position (MGRS, etc.), TownshipAndRange, TexasAbstract
|
Optional Columns
|
|
Column Heading
|
Default Value
|
Description
|
|
Name
|
Spreadsheet Row Number
|
The text displayed next to the icon on Google Earth.
If blank, no text is displayed.
If the Name column is not in the spreadsheet, then the spreadsheet row number is displayed.
|
|
Icon
|

|
Icon can be any of:
- An integer between 1 to 279, which designates an icon selected from the table below;
- The URL of an icon stored on a web site;
- The path of a file on your hard drive or network drive, for example
C:/folder/file.jpg or
file:///C:folder/file.jpg
(note the three slashes, not two, after "file:");
- The word "none".
If the file cannot be found, Google displays
 . .
If "none", no icon is displayed.
If blank,
is displayed.
|
IconColor
IconColour
|
none
|
Changes the icon color.
Possible values include Red, DarkOrange, Yellow, Chartreuse, Lime, SpringGreen, Cyan, DodgerBlue, Blue, DarkViolet, Magenta, DeepPink
Click for more details.
|
|
Folder
|
blank
|
Organizes the data into folders and subfolders. When viewing the data in Google
Earth, the entire contents of a folder can be hidden or shown by clicking the folder
in the "My Places" window. Both forward-slashes and back-slashes can be used to
separate the folder levels.
Examples:
Country One
Country One/City One/Street One
Country One/City Two
Country Three/Office Four/Room Six
|
|
HideNameUntilMouseOver
|
False
|
An easy way to reduce map clutter when several icons are located close together.
Valid values are "True", "Yes", "x", "False", "No", and blank. If True, the icon
is displayed with no label, until mouse over, then the label is displayed. If False,
the label is always displayed. If there are many rows in your data, is helpful to hide
the labels to reduce screen clutter.
If blank, or if column is omitted, Name is always displayed, regardless of mouse-over.
|
Advanced Optional Columns
|
|
Column Heading
|
Default Value
|
Description
|
|
IconText
|

|
Used in place of Name and Icon.
IconText displays text inside the icon on Google Earth. For example, if the IconText column contains Hello world, then the icon on Google Earth would be:
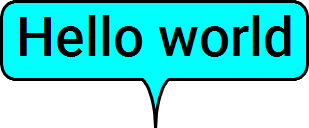
The IconColor column can be used to color the icons. The following illustration shows IconColor values of Red, Yellow, Lime, Cyan, and Magenta
The text inside each icon comes from the IconText column of the spreadsheet.
A spreadsheet example:
|
|
A
|
B
|
C
|
E
|
|
1
|
Latitude
|
Longitude
|
IconText
|
IconColor
|
|
2
|
44.5
|
-105.34
|
This icon is Red.
|
Red
|
|
2
|
44.5
|
-105.33
|
I am Yellow.
|
Yellow
|
|
2
|
44.5
|
-105.32
|
Lime is nice ☺
|
Lime
|
|
2
|
44.5
|
-105.31
|
Magenta is to the right.
|
Cyan
|
|
2
|
44.5
|
-105.30
|
Cyan is to the left.
|
Magenta
|
If blank,
is displayed.
|
|
Picture
|
none
|
Displays a picture in the pop-up balloon when an icon is clicked in Google Earth.
Valid values:
- The web address (that is, the URL) of a picture on the internet.
- The complete path and file name of a picture on your hard drive or on your network. This picture will only be visible if you are using Google Earth on a computer that has access to that hard drive.
Note: If the cell value starts with "<img", then Earth Point takes no action, the assumption being that the cell value is already formatted to properly display a picture.
|
|
Description
|
All data columns are displayed
|
The text displayed in the Google Earth pop-up balloon.
If the Description column is not on the spreadsheet, then all of the data columns are displayed in Google Earth.
An Excel formula can be used to combine text from several columns. For example,
to display data from columns D, E, and F, with each of D, E, and F on its own line,
and supposing we are on row 6, the Description column formula is
=D6 & "<br/>" & E6 & "<br/>" & F6
where <br/> is the html tag for a new line.
HTML tags are allowed.
If blank, no balloon is displayed.
Note: The easiest option is to not use the Description column at all. In this case, all of the data columns are displayed when the icon is clicked in Google Earth.
This is equivalent to using the AppendDataColumnsToDescription column heading, and setting the cell value to TRUE.
AppendDataColumnsToDescription can also be used to list which columns should be displayed and in what order.
|
|
AppendDataColumnsToDescription
|
True
|
Valid values are "True", "Yes", "x", "False", "No", blank, or a list of column names.
If "True", "Yes", or "x": appends spreadsheet data to the Description text. Includes
all columns NOT used to format the Excel To Kml output. Also includes the "Name",
"Latitude", "Longitude", "Position", and "TownshipAndRange" columns. "Name" is used
as the Description title.
Note - if a spreadsheet column is hidden, then it is not included.
If "False", "No", or blank: does nothing.
If a list of column names, such as "Address, Price, City, Color, Region": these
columns (if they exist in the spreadsheet) are appended to the Description in the
order listed. If "Name" is included in the list, then the "Name" value forms the
Description title.
Will be "True" if the Description and AppendDataColumnsToDescription columns are not on the spreadsheet.
|
|
AppendLatLonToDescription
|
True
|
Valid values are "True", "Yes", "x", "False", "No", and blank. If true, appends
Latitude and Longitude information to the Description text. Useful for seeing the
translation of coordinates that are entered into the Position
column. The description text is displayed in the Google Earth pop-up balloon. The
description text is also displayed in the spreadsheet view on this web page.
The following example reports that "30UXC3542" is entered into the Position column,
that it is an MGRS coordinate for a 1-kilometer grid, and that the equivalent Lat/Lon
is 51.812518, -1.0416
|
MGRS KM:
|
30UXC3542
|
|
Lat, Lon:
|
51.812518, -1.0416
|
If blank, no text is appended to the Description text.
If the spreadsheet does not have a "Description" column, the text will nonetheless
be displayed in the Google Earth pop-up balloon. However, no text will be added
to the spreadsheet view on this web page.
Will be "True" if the Description and AppendDataLatLonToDescription columns are not on spreadsheet, and if the coordinate type is not Latitude and Longitude (that is, it is of Position, TownshipAndRange, or TexasAbstract).
|
ep_Circle
ep_Radius
|
none
|
Draws a circle. Value in the cell is the circle's radius in meters.
Supports other columns such as LineStringColor and LineStringWidth
|
Extrude
IconExtrude
LineStringExtrude
|
True
|
If IconAltitude or LinestringAltitude are used to raise the icon or the linestring (or polygon) above the
surface of the Earth, then a vertical line is drawn from the icon to the surface, or from each point along
the linestring (or polygon) to the surface. This give a 3-D look to the image. However, if the vertical lines
are not wanted, then set the column value to FALSE.
See IconAltitude, LinestringAltitude just below.
|
|
IconAltitude
|
0
|
Height of icon above the ground (default) or sea level (optional), in meters.
If blank, height is 0.
See IconAltitudeMode, just below.
|
|
IconAltitudeMode
|
Relative
|
If blank, "Relative", "AGL", or "AboveGroundLevel", the altitude of the icon is
measured from ground level.
If "Absolute", "MSL", or "MeanSeaLevel", the altitude of the icon measured from
sea level.
"RelativeToSeaFloor", interprets the altitude as a value in meters above the sea floor. If the point is above land rather than sea, the altitude
will be interpreted as being above the ground.
"ClampToSeaFloor", the altitude specification is ignored, and the point will be positioned on the sea floor. If the point is on land rather than at sea, the point will be positioned on the ground.
|
IconColor
IconColour
|
None
|
Fills an icon with a color.
Can be any of
- an HTML named color,
- an HTML hexadecimal color code,
- a Hue value,
- the word "none".
If blank or "none", the icon displays its default colors (see icon table below at the bottom of the
page).
Bright colors show up best on Google Earth.
Bright named colors:
|
|
|
Red
|
DarkOrange
|
Yellow
|
Chartreuse
|
|
|
Lime
|
SpringGreen
|
Cyan
|
DodgerBlue
|
|
|
Blue
|
DarkViolet
|
Magenta
|
DeepPink
|
|
|
|
|
Black
|
Gray
|
Silver
|
White
|
Same bright colors as hexadecimal values:
|
|
|
FF0000
|
FF8000
|
FFFF00
|
80FF00
|
|
|
00FF00
|
00FF80
|
00FFFF
|
0080FF
|
|
|
0000FF
|
8000FF
|
FF00FF
|
FF0080
|
|
|
|
|
000000
|
808080
|
C0C0C0
|
FFFFFF
|
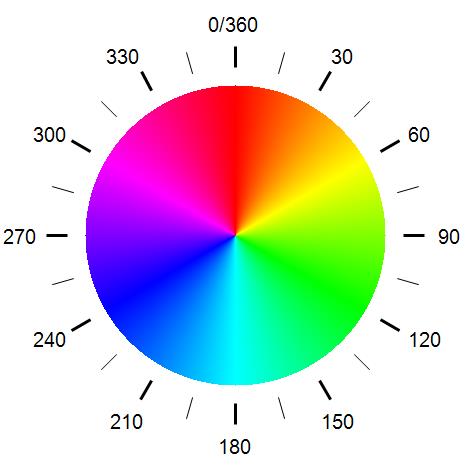
Same bright colors as Hue values:
|
|
|
0
|
30
|
60
|
90
|
|
|
120
|
150
|
180
|
210
|
|
|
240
|
270
|
300
|
330
|
|
|
|
|
No black or gray colors if Hue is specified.
|
All Hue values from 0 to 360:
|
|
Colors that come close to matching the Google Earth thumbtack and paddle icon colors (icon numbers 111 to 194 in the table at the bottom of this page):
|
|
|
Yellow
|
CornflowerBlue
|
Lime
|
Cyan
|
|
|
HotPink
|
MediumPurple
|
Tomato
|
White
|
Same colors as hexadecimal values:
|
|
|
FFFF00
|
6495ED
|
00FF00
|
00FFFF
|
|
|
FF69B4
|
9370DB
|
FF6347
|
FFFFFF
|
|
|
|
|
IconHeading
|
None
|
Rotates an icon.
Can be a number, the word "line" or the word "line" plus or minus a number.
A positive number rotates the icon to the right by the number of degrees specified
by the number.
A negative number rotates the icon to the left.
The word "line" rotates the icon to face in the direction of travel.
The word "line" plus or minus a number rotates the icon to face the direction of
travel, then rotates it some more as specified by the number.
For example, the airplane, icon 222
 points "up" or north by default.
So, we use "line" to align the icon with the direction of travel.
points "up" or north by default.
So, we use "line" to align the icon with the direction of travel.
However, the arrow, icon 196
 points "down" or south by default.
So, we use "line-180" to turn the icon around and align it with the direction of travel.
points "down" or south by default.
So, we use "line-180" to turn the icon around and align it with the direction of travel.
If blank, or 0, the icon is not rotated.
|
IconLineColor
IconLineColour
|
Yellow
|
If the icon is elevated above the ground (see IconAltitude) this is the color
of the line drawn from ground up to the icon.
See IconColor for details.
If "none", the line is not displayed.
If blank, color is yellow.
|
|
IconOpacity
|
100
|
The opacity of the icon. (Opacity is the opposite of transparency).
Can be any number from 0 to 100. 0 is no opacity (same as completely transparent). 100 is completely opaque (same as a solid color, no transparency).
If blank, then a value of 100 is used (solid color, no transparency).
|
|
IconScale
|
1
|
A decimal number that increases or decreases the display size of the icon. Typical
values are in the range of .5 to 1. No matter how big or small an image actually
is, Google Earth displays it according to the scale. For example,
Scale=1
|

Scale=.7
|

Scale=1.5
|
If blank, scale is 1.
|
|
IsVisible
|
True
|
Hides or shows the item in Google Earth. The is equivalent to checking or un-checking the
check box to the left of each item in the Google Earth "Places" window.
Valid values are "True", "Yes", "x", "False", "No", and blank. If True, the item is displayed.
If False, the item is hidden.
If there are thousands of rows in your data, the performance of Google Earth is much improved by hiding the items.
The item can be displayed by clicking the check-box in Google Earth.
If the Folder column heading is also used, all of the items in the folder can be hidden or displayed by clicking the
folder's check-box in Google Earth.
Note - if a row is hidden, for example by using the Excel "Filter", then regardless of the "IsVisible" setting, it is not mapped at all.
If blank, or if column is omitted, the item is visible.
|
LabelColor
LabelColour
|
White
|
Color of the label that is displayed next to the ion on Google Earth.
See IconColor for details.
If "none", the label is not displayed. If blank, the label is white.
|
|
LabelScale
|
1
|
Size of the label that is displayed next to the ion on Google Earth. Typical values
are in the range of .8 to 2.
If blank, the scale is 1.
|
LineStringName
LineName
|
none
|
LineStringName is listed in the "Places" window of Google Earth.
If blank, no text is displayed.
If the LineStringName changes from one row to the next, then it marks the start of a new line.
|
|
LineStringAltitude
|
0
|
The altitude, in meters above the ground, of this end of the LineString.
If blank, altitude is 0.
|
|
LineStringAltitudeMode
|
Relative
|
If blank, "Relative", "AGL", or "AboveGroundLevel", the altitude of the line is
measured from ground level.
If "Absolute", "MSL", or "MeanSeaLevel", the altitude of the line measured from
sea level.
"RelativeToSeaFloor", interprets the altitude as a value in meters above the sea floor. If the point is above land rather than sea, the altitude
will be interpreted as being above the ground.
"ClampToSeaFloor", the altitude specification is ignored, and the point will be positioned on the sea floor. If the point is on land rather than at sea, the point will be positioned on the ground.
|
LineStringColor
LineStringColour
|
None
|
"Connect the dots" - draws a line from this point to the next.
See IconColor for details.
Note - a polygon is drawn if three or more consecutive spreadsheet rows have the same LineStringColor and LineStringWidth, and if the coordinates of the first of these rows match the coordinates of the last of these rows.
If "none" or blank, the line is not displayed.
Except that if LineStringColor is blank and any of LineStringWidth, LineStringAltitude, LineStringAltitudeMode, or ep_Circle
are specified, then the color will be red.
|
|
LineStringDescription
|
None
|
The text displayed in the line's Google Earth pop-up balloon.
An Excel formula can be used to combine text from several columns. For example,
to display data from columns D, E, and F, with each of D, E, and F on its own line,
and supposing we are on row 6, the LineStringDescription column formula is
=D6 & "<br/>" & E6 & "<br/>" & F6
where <br/> is the html tag for a new line.
HTML tags are allowed.
If blank, no balloon is displayed when the line is clicked.
|
|
LineStringWidth
|
2
|
Width of the line drawn from one point to the next. A decimal number, typically
in the range of 1 to 3.
If 0, the line is not displayed.
If blank, width is 2.
|
|
AppendDataColumnsToLineStringDescription
|
None
|
Valid values are "True", "Yes", "x", "False", "No", blank, or a list of column names.
If "True", "Yes", or "x": appends spreadsheet data to the LineStringDescription text. Includes
all columns NOT used to format the Excel To Kml output. Also includes the "Name",
"Latitude", "Longitude", "Position", and "TownshipAndRange" columns. "Name" is used
as the Description title.
If "False", "No", or blank: does nothing.
If a list of column names, such as "Address, Price, City, Color, Region": these
columns (if they exist in the spreadsheet) are appended to the Description in the
order listed. If "Name" is included in the list, then the "Name" value forms the
Description title.
|
|
AppendLatLonToLineStringDescription
|
None
|
Valid values are "True", "Yes", "x", "False", "No", and blank. If true, appends
Latitude and Longitude information to the LineStringDescription text. Useful for seeing the
translation of coordinates that are entered into the Position
column. The description text is displayed in the Google Earth pop-up balloon. The
description text is also displayed in the spreadsheet view on this web page.
The following example reports that "30UXC3542" is entered into the Position column,
that it is an MGRS coordinate for a 1-kilometer grid, and that the equivalent Lat/Lon
is 51.812518, -1.0416
|
MGRS KM:
|
30UXC3542
|
|
Lat, Lon:
|
51.812518, -1.0416
|
If blank, no text is appended to the Description text.
If the spreadsheet does not have a "Description" column, the text will nonetheless
be displayed in the Google Earth pop-up balloon. However, no text will be added
to the spreadsheet view on this web page.
|
|
LookAtHeading
|
0
|
If an icon is double-clicked in Google Earth, or its label in the Places window, Google Earth will spin
so that the viewer is looking in this direction.
|
|
LookAtRange
|
1000 meters from the icon
|
If an icon is double-clicked in Google Earth, or its label in the Places window, Google Earth will move
so that the viewer this far from the icon (slant range distance, in meters).
|
|
LookAtTilt
|
0
|
If an icon is double-clicked in Google Earth, or its label in the Places window, Google Earth will tilt
so that the viewer is looking at the icon at this angle.
If 0, then looking straight down. If 90, then looking straight across.
|
|
PolygonName
|
none
|
Polygon name is listed in the "Places" window of Google Earth.
If blank, no text is displayed.
If the PolygonName changes from one row to the next, then it marks the start of a new polygon.
|
PolygonColor
PolygonOutlineColor
PolygonColour
PolygonOutlineColour
|
None
|
Draws a polygon with the specified outline color.
See IconColor for details.
If "none" or blank, the polygon is not displayed.
|
PolygonFillColor
PolygonFillColour
|
none
|
See IconColor for details.
If PolygonFillColor is specified, and if two or more consecutive points have the same polygon styling, then a
polygon will be drawn. The first and last points of the polygon do not have to match.
|
|
PolygonFillOpacity
|
30
|
The opacity of the polygon fill color.
Can be any number from 0 to 100. 0 is no opacity (same as transparent, or no fill color). 100 is completely opaque (same as a solid fill color).
If PolygonFillOpacity is specified, and if two or more consecutive points have the same polygon styling, then a
polygon will be drawn. The first and last points of the polygon do not have to match.
If blank, then a value of 30 is used.
|
|
PolygonFillType
|
Outlined
|
Can be any of "Outlined", "Filled", or "FilledAndOutlined".
If PolygonFillType is specified, and if two or more consecutive points have the same polygon styling, then a
polygon will be drawn. The first and last points of the polygon do not have to match.
|
|
Position
|
None
|
The position of the icon, in a number of formats:
LatLon,
UTM,
UPS,
MGRS,
MGRS Polar,
USNG (identical to MGRS),
GARS,
Maidenhead,
Georef,
Plus Codes,
what3words, and
State Plane.
Used in place of Latitude and Longitude.
If converting UTM/UPS or State Plane, see also Zone, Easting, Northing.
The following positions refer to 39° 18' 40.58" N 102° 17' 30.47" W
which is near Burlington, Colorado, USA.
In the following table, "d" is used to mark degree digits, "m" for minutes, and
"s" for seconds. For lat/lon, the letters "N, S, E, and W can come before or after
the coordinates. So long as the coordinate can be understood, punctuation, spaces,
and °'" are optional. Acceptable formats include:
|
Dec Degs
|
39.3112722°, -102.2917972°
dd.dddddd ddd.dddddd
|
|
Dec Degs Micro
|
39.3112722N,102.2917972W
dd.dddddd ddd.dddddd
|
|
Dec Mins
|
39°18.67633', -102°17.50783'
ddmm.mmmm dddmm.mmmm
|
|
Dec Mins
|
3918.67633N10217.50783W
ddmm.mmmm dddmm.mmmm
|
|
Deg Min Secs
|
39°18'40.58, -102°17'30.47
dd mm ss.sss dd mm ss.sss
|
|
Dec Mins Secs
|
391840.58N, 1021730.47W
ddmmss.sss dddmmss.sss
|
|
UTM
|
13S 733494mE 4354817mN
Note that UTM position "13S" is in the Northern hemisphere. Earth Point uses
the convention that the UTM Band letters C, D, E, F, G, H, J, K, L, M are in the
southern hemisphere and N, P, Q, R, S, T, U, V, X are in the northern hemisphere.
UPS letters A, B, Y, Z are also supported.
|
|
MGRS, USNG
|
13SGD3349454817
|
|
State Plane
|
United States State Plane coordinates.
Easting and Northing (X and Y) can be in Meters, US Survey Feet, or International
Feet, where
1 US survey foot = 1200/3937 meters, and
1 international foot = 0.3048 meters
Our sample point, 39° 18' 40.58" N 102° 17' 30.47" W,
is located in Zone 3001, "Colorado Central"
The position is specified as "Zone X Y" as follows:
0502 1191021.721 473748.480 (meters is assumed)
0502 1191021.721m 473748.480m (meters)
0502 3907543.764UsFt 1554289.806UsFt (US Survey Feet)
0502 3907551.579ft 1554292.915ft (International Feet)
Supported units of measure
|
m, or not specified
|
Meters
|
|
USft, ftUS, sft, fts
|
US Survey Feet
|
|
ft, ift, fti
|
International Feet
|
X, Y, East, and North
By default, the X coordinate, or Easting is specified first and the Y coordinate,
or Northing is specified second. However, the order can be reversed if coordinates
are explicitly labeled. Example:
|
0502 3907543.764 1554289.806
|
Normal specification - Zone 1102 followed by Easting and Northing in US Survey Feet
|
|
0502 3907543.764UsFtE 1554289.806UsFtN
|
Same coordinate, order reversed, Northing followed by Easting.
|
|
0502 1554289.806UsFtY 3907543.764UsFtX
|
Order reversed, Y coordinate is first, X coordinate is second.
|
|
|
Plus Codes
|
85FV8P65+G74VH5V
|
|
what3words
|
layers.invented.entries
|
|
GARS
|
156LU19
|
|
Maidenhead
|
DM89UH44XQ69
An extended twelve-digit grid is supported. The lowest level grid measures
.125 seconds of longitude x .0625 seconds of latitude.
|
|
|
deg min
|
39°18.67', -102°17.51'
dd mm.mm ddd mm.mm
|
|
Georef
|
FJCK42491867
Georef is specified to .01 minutes, which is a lower resolution than the other systems supported by Earth Point.
Thus, Georef cannot plot the above location exactly. The next two points are the
same, but they are about 570 meters southeast of the points above.
|
UPS is supported. This point is by the North Pole.
|
|
Deg Min Secs
|
84°17'14.0363"N, 042°14'52.4473E"
dd mm ss.ssss ddd mm ss.ssss
|
|
UPS
|
Z2426773E1530125N
|
|
MGRS
|
ZGC2677330125
|
The equivalent Lat/Lon coordinates can be displayed by:
- Add an AppendLatLonToDescription
column to the spreadsheet. If the spreadsheet also has a "Description" column, then
the Lat/Lon coordinates will be added to the description.
- Click the "View File on Web Page, Check for errors" button above. Mouse-over the
Position column entries. The Lat/Lon coordinates are displayed.
For each row of the spreadsheet:
Exactly one of Latitude and Longitude, Position, TownshipAndRange, or TexasAbstract
must be filled in. The others must be blank. If all are blank, or if more than one
is filled in, then the row is in error and will not be mapped.
|
|
TownshipAndRange
|
None
|
Western United States only, in a number of formats. Used in place of Latitude and
Longitude or Position.
The Quarter/Quarter closest to our example position 39° 18' 40.58" N 102° 17' 30.47" W
is the SE 1/4 of the NW 1/4 of Section 35, Range 44 West, Township 8 South, Sixth
Meridian, Colorado.
Verbose, forward and reversed
SE 1/4 of the NW 1/4 of Section 35, Range 44 West, Township 8 South, Sixth Meridian,
Colorado
Colorado, Sixth Meridian, Township 8 South, Range 44 West, Section 35, SE 1/4 of
the NW 1/4
Abbreviated, forward and reversed
SENW 35 44W 8S 6th CO
CO 6th 8S 44W 35 SENW
If there is no possibility of duplication, the state or the meridian can be dropped.
In the above examples, both
SENW 35 44W 8S 6th and
SENW 35 44W 8S CO are both allowed.
However, some states have more than one meridian, for example California has three.
CA 14N 6E could be in any of the Humboldt, Mount Diablo, or San Bernardino meridians.
Yet, Humboldt 14N 6E is allowed, as there is no chance of duplication.
Likewise, a single meridian can cross into more than one state, causing duplication
along the border. For example,
6th 12N 84W could be in either Colorado or Montana. However, Colorado 12N 84 West
and Montana 12N 84W are permitted as there is no possibility of duplication.
Other formats
USGS Meridian Code may be used in place of the meridian name
For example, California Humboldt 14N 6E would be CA 15 14N 6E
BLM "Landkey"
CO 6th 8S 44W 35 SENW would be
CO06T0080S0440W035SENW
BLM Geocoder format
CA,21,016,0,N,002,0,W,029,NENE,0
CO,6,8,0,S44,0,W,35,SENW,0
USGS
Code
|
Meridian Name
|
|
1
|
First
|
|
2
|
Second
|
|
3
|
Third
|
|
4
|
Fourth
|
|
5
|
Fifth
|
|
6
|
Sixth
|
|
7
|
Black Hills
|
|
8
|
Boise
|
|
9
|
Chickasaw
|
|
10
|
Choctaw
|
|
11
|
Cimarron
|
|
12
|
Copper River
|
|
13
|
Fairbanks
|
|
14
|
Gila-Salt River
|
|
15
|
Humboldt
|
|
16
|
Huntsville
|
|
17
|
Indian
|
|
18
|
Louisiana
|
|
19
|
Michigan
|
|
20
|
Montana
|
|
21
|
Mount Diablo
|
|
22
|
Navajo
|
|
23
|
New Mexico
|
|
24
|
St. Helena
|
|
25
|
St. Stephens
|
|
26
|
Salt Lake
|
|
27
|
San Bernardino
|
|
28
|
Seward
|
|
29
|
Tallahassee
|
|
30
|
Uintah
|
|
31
|
Ute
|
|
32
|
Washington
|
|
33
|
Willamette
|
|
34
|
Wind River
|
|
35
|
Ohio River Base
|
|
36
|
Between the Miamis
|
|
37
|
Muskingham River
|
|
38
|
38 Unknown
|
|
39
|
Scioto River Base (First)
|
|
40
|
Scioto River Base
|
|
41
|
Scioto River Base (Third)
|
|
42
|
Unknown
|
|
43
|
Twelve-Mile-Square
|
|
44
|
Kateel River
|
|
45
|
Umiat
|
|
47
|
West of the Great Miami
|
|
48
|
U.S. Military Survey
|
|
91
|
Connecticut Western
|
|
92
|
Ohio Company Purchase
|
The equivalent Lat/Lon coordinates can be displayed by:
- Add an AppendLatLonToDescription
column to the spreadsheet. If the spreadsheet also has a "Description" column, then
the Lat/Lon coordinates will be added to the description.
- Click the "View File on Web Page, Check for errors" button above. Mouse-over the
Position column entries. The Lat/Lon coordinates are displayed.
For each row of the spreadsheet:
Exactly one of Latitude and Longitude, Position, TownshipAndRange, or TexasAbstract
must be filled in. The others must be blank. If all are blank, or if more than one
is filled in, then the row is in error and will not be mapped.
|
|
TexasAbstract
|
None
|
State of Texas, United States only, in a number of formats. Used in place of Latitude
and Longitude or Position.
Example, abstract 1025 in Anderson county:
The FIPS code for Anderson county is 001, so the complete abstract number is 0011025.
The county name can be used in place of the FIPS code, as in Anderson 1025. The
space between the county name or code and abstract number is optional.
The following values will be interpreted as abstract 1025 in Anderson county.
="0011025"
="001 1025"
'001 1025
'0011025
Anderson1025
Anderson 1025
Note that Excel removes leading zeros from numeric values. If 0011025 is entered
into a cell, the value stored is 11025. Unfortunately, 11025 is not the number of
any Texas Abstract. There are several ways to preserve the leading zeros.
1) Enter the value as a formula, ="0011025"
2) Precede the numeric value with a single quote, '0011025
3) Use the Excel toolbar to format the cell as "text".
The equivalent Lat/Lon coordinates can be displayed by:
- Add an AppendLatLonToDescription
column to the spreadsheet. If the spreadsheet also has a "Description" column, then
the Lat/Lon coordinates will be added to the description.
- Click the "View File on Web Page, Check for errors" button above. Mouse-over the
Position column entries. The Lat/Lon coordinates are displayed.
For each row of the spreadsheet:
Exactly one of Latitude and Longitude, Position, TownshipAndRange, or TexasAbstract
must be filled in. The others must be blank. If all are blank, or if more than one
is filled in, then the row is in error and will not be mapped.
|
|
Snippet
|
None
|
A short text description that is displayed under the Name in the "My Places" section
of Google Earth.
If blank, no text is displayed.
|
|
TimeWhen
|
None
|
TimeWhen identifies a location that is to be displayed at a single moment in time.
If blank or invalid the value is ignored.
If you have GPS tracks or other data that contains time information, you can view
this information sequentially using the time slider in Google Earth.
Google Earth Blog
has more information about the time slider.
Valid formats include:
August 17, 2007 1:09:26 PM
8/17/07 13:09:26
2007-08-17 13:09:26
1:09:26 PM
2007-08-17
Eras are supported. AD (Anno Domini), BC (Before Christ), CE (Common Era), and BCE
(Before Common Era), +, and - can appear before or after the date, or the era can
be entered separately into the TimeWhenEra column.
Generally speaking, the TimeWhenEra column is the easiest way to add an era. The
reason is that if era is entered together with the date in the TimeWhen column,
the date formatting will likely be lost, causing the Excel To Kml utility to report
an invalid value.
However, if the era is to appear together with the date in the TimeWhen column,
as might be the case if the data is imported into Excel from another source, then
the following are a few valid examples:
8/17/07 13:09:26 BC
B.C.E. 8/17/07 13:09:26
AD 8/17/07 13:09:26
It is also possible to use a formula in the TimeWhen column to combine date and
era.
|
|
...
|
C
|
D
|
E
|
|
1
|
...
|
Date
|
Era
|
TimeWhen
|
|
2
|
...
|
2007-08-17
|
BC
|
=Text(C2, "yyyy-mm-dd") & D2
|
|
3
|
...
|
Aug 17, 2007
|
B.C.E.
|
=Text(E3, "yyyy-mm-dd") & D3
|
|
4
|
...
|
8/17/07
|
-
|
=Text(E4, "yyyy-mm-dd") & D4
|
The result in column E would be
2007-08-17 BC
2007-08-17 B.C.E.
2007-08-17 - (minus sign)
|
|
TimeWhenEra
|
blank
|
Eras are supported.
AD or A.D. (Anno Domini),
BC or B.C. (Before Christ),
CE or C.E. (Common Era),
BCE or B.C.E. (Before Common Era),
+ (plus),
- (minus)
If blank or invalid the value is Common Era, also known as AD.
|
|
TimeBegin
|
None
|
Indicates that the location is displayed for a span of time starting at TimeBegin.
TimeBegin is often paired with TimeEnd. However, if TimeBegin is specified, but
TimeEnd is missing, the location is displayed from TimeBegin forever after.
Eras are supported. See TimeWhen for details.
If blank or invalid the value is ignored.
|
|
TimeBeginEra
|
blank
|
Eras are supported.
AD or A.D. (Anno Domini),
BC or B.C. (Before Christ),
CE or C.E. (Common Era),
BCE or B.C.E. (Before Common Era),
+ (plus),
- (minus)
If blank or invalid the value is Common Era, also known as AD.
|
|
TimeEnd
|
None
|
Indicates that the location is displayed for a span of time ending at TimeEnd. TimeEnd
is often paired with TimeBegin. However, if TimeEnd is specified, but TimeBegin
is missing, the location is displayed form the beginning of time until TimeEnd.
Eras are supported. See TimeWhen for details.
If blank or invalid the value is ignored.
|
|
TimeEndEra
|
blank
|
Eras are supported.
AD or A.D. (Anno Domini),
BC or B.C. (Before Christ),
CE or C.E. (Common Era),
BCE or B.C.E. (Before Common Era),
+ (plus),
- (minus)
If blank or invalid the value is Common Era, also known as AD.
|
|
All other columns are ignored.
|
|
Any additional columns are ignored. They are not used by Excel To KML.
However, by default, these columns are displayed in the pop-up window when an icon is clicked in Google Earth.
|
Google Earth Icons
These icons can be displayed on Google Earth by entering the icon number into the
"Icon" column of the spreadsheet. Move your mouse over each icon to see what
the mouse-over effect will look like on Google Earth. If you want to give the icons a different color,
add an "IconColor" column to your spreadsheet.
| 1 |  | 2 |  | 3 |  | 4 |  | 5 |  | 6 |  | 7 |  | 8 |  | 9 |  | 10 |  | | 11 |  | 12 |  | 13 |  | 14 |  | 15 |  | 16 |  | 17 |  | 18 |  | 19 |  | 20 |  | | 21 |  | 22 |  | 23 |  | 24 |  | 25 |  | 26 |  | 27 |  | 28 |  | 29 |  | 30 |  | | 31 |  | 32 |  | 33 |  | 34 |  | 35 |  | 36 |  | 37 |  | 38 |  | 39 |  | 40 |  | | 41 |  | 42 |  | 43 |  | 44 |  | 45 |  | 46 |  | 47 |  | 48 |  | 49 |  | 50 |  | | 51 |  | 52 |  | 53 |  | 54 |  | 55 |  | 56 |  | 57 |  | 58 |  | 59 |  | 60 |  | | 61 |  | 62 |  | 63 |  | 64 |  | 65 |  | 66 |  | 67 |  | 68 |  | 69 |  | 70 |  | | 71 |  | 72 |  | 73 |  | 74 |  | 75 |  | 76 |  | 77 |  | 78 |  | 79 |  | 80 |  | | 81 |  | 82 |  | 83 |  | 84 |  | 85 |  | 86 |  | 87 |  | 88 |  | 89 |  | 90 |  | | 91 |  | 92 |  | 93 |  | 94 |  | 95 |  | 96 |  | 97 |  | 98 |  | 99 |  | 100 |  | | 101 |  | 102 |  | 103 |  | 104 |  | 105 |  | 106 |  | 107 |  | 108 |  | 109 |  | 110 |  | | 111 |  | 112 |  | 113 |  | 114 |  | 115 |  | 116 |  | 117 |  | 118 |  | 119 |  | 120 |  | | 121 |  | 122 |  | 123 |  | 124 |  | 125 |  | 126 |  | 127 |  | 128 |  | 129 |  | 130 |  | | 131 |  | 132 |  | 133 |  | 134 |  | 135 |  | 136 |  | 137 |  | 138 |  | 139 |  | 140 |  | | 141 |  | 142 |  | 143 |  | 144 |  | 145 |  | 146 |  | 147 |  | 148 |  | 149 |  | 150 |  | | 151 |  | 152 |  | 153 |  | 154 |  | 155 |  | 156 |  | 157 |  | 158 |  | 159 |  | 160 |  | | 161 |  | 162 |  | 163 |  | 164 |  | 165 |  | 166 |  | 167 |  | 168 |  | 169 |  | 170 |  | | 171 |  | 172 |  | 173 |  | 174 |  | 175 |  | 176 |  | 177 |  | 178 |  | 179 |  | 180 |  | | 181 |  | 182 |  | 183 |  | 184 |  | 185 |  | 186 |  | 187 |  | 188 |  | 189 |  | 190 |  | | 191 |  | 192 |  | 193 |  | 194 |  | 195 |  | 196 |  | 197 |  | 198 |  | 199 |  | 200 |  | | 201 |  | 202 |  | 203 |  | 204 |  | 205 |  | 206 |  | 207 |  | 208 |  | 209 |  | 210 |  | | 211 |  | 212 |  | 213 |  | 214 |  | 215 |  | 216 |  | 217 |  | 218 |  | 219 |  | 220 |  | | 221 |  | 222 |  | 223 |  | 224 |  | 225 |  | 226 |  | 227 |  | 228 |  | 229 |  | 230 |  | | 231 |  | 232 |  | 233 |  | 234 |  | 235 |  | 236 |  | 237 |  | 238 |  | 239 |  | 240 |  | | 241 |  | 242 |  | 243 |  | 244 |  | 245 |  | 246 |  | 247 |  | 248 |  | 249 |  | 250 |  | | 251 |  | 252 |  | 253 |  | 254 |  | 255 |  | 256 |  | 257 |  | 258 |  | 259 |  | 260 |  | | 261 |  | 262 |  | 263 |  | 264 |  | 265 |  | 266 |  | 267 |  | 268 |  | 269 |  | 270 |  | | 271 |  | 272 |  | 273 |  | 274 |  | 275 |  | 276 |  | 277 |  | 278 |  | 279 |  | 1a | 1b |
Oil And Gas Icons
These icons can be displayed on Google Earth by entering the icon number into the
"Icon" column of the spreadsheet. Move your mouse over each icon to see what
the mouse-over effect will look like on Google Earth. If you want to give the icons a different color,
add an "IconColor" column to your spreadsheet.
| 6001 |  | 6002 |  | 6003 |  | 6004 |  | 6005 |  | | Oil Well | Plugged And Abandoned Oil Well | Suspended Oil Gas Well | Suspended Oil Well | Suspended Well | | 6006 |  | 6007 |  | 6008 |  | 6009 |  | 6010 |  | | Water Well | Gas Shows Well | Gas Well | Location Well | Oil Gas Well | | 6011 |  | 6012 |  | 6013 |  | 1a | 1b | 2a | 2b | | Oil Gas Shows Well | Suspended Gas Well | Dry Hole Well | | |
Wind Icons
| 6021 |  | | Wind Turbine |
Icon Text
Text can be displayed in an icon by using the "IconText" column heading. An "Icon" column heading is not needed. Move
your mouse over each icon to see what the mouse-over effect will look like on Google Earth. If you want to color the icon,
use the "IconColor" column ("Icon" column is not needed) or use one of the following "Icon" numbers (in which case the "Icon" column
is needed). If neither IconColor nor Icon number is specified, the default color is Cyan.
| 8001 |  | 8002 |  | 8003 |  | 8004 |  | 8005 |  | 8006 |  | 8007 |  | 8008 |  |
Examples of icons that can be created with the "IconText" column combined with either the "Icon" or "IconColor" columns.
| 8001 |  | 8002 |  | 8003 |  | 8004 |  | 8005 |  | 8006 |  | 8007 |  | 8008 |  |
Equivalent IconColor | | Yellow | CornflowerBlue | Lime | Cyan | HotPink | MediumPurple | Tomato | White |
|
|